Average Cost of a Master’s Degree
How much is a Master's Degree in US?
In general, master’s degrees take up to two years to complete. The cost of master’s degrees usually depends on the institution, program, and students’ country of origin.
- 832,000 master’s degrees were conferred in the United States in 2020.
- The average cost of a master’s degree for in-state students is $21,412 per year.
- For out-of-state students, the average cost of a master’s degree ranges from $30,000 to $150,000 for the entire program.
- During the academic year of 2021-2022, Vermont was the most expensive state in terms of in-state tuition ($18,406 for in-state students).
- The least expensive state in terms of tuition fees for in-state students during the academic year of 2021-2022 was Wyoming ($6,015).
- A Master’s degree in Business Administration (MBA) costs an average of $66,300.
- A Master’s degree in Education costs an average of $55,200.
- A Master’s degree in Science costs an average of $62,300.
- A Master’s degree in Arts costs an average of $72,800 in total.
- An MBA costs around $74,706 per year at the University of Stanford, meanwhile an Arts degree costs around $42,275 at Yale School of Art.
- Approximately 1.3 million of all graduate students are enrolled in at least one distance education course.
- The average aid per full-time equivalent (FTE) graduate student is $26,920.
- 0.2 million borrowers aged 24 or younger had a debt size of $3.6 billion in 2021.
- During the academic year of 2015-2016, the average student debt across all types of institutions was $64,400.
- In 2021, American families spent an average amount of $26,373 on college.
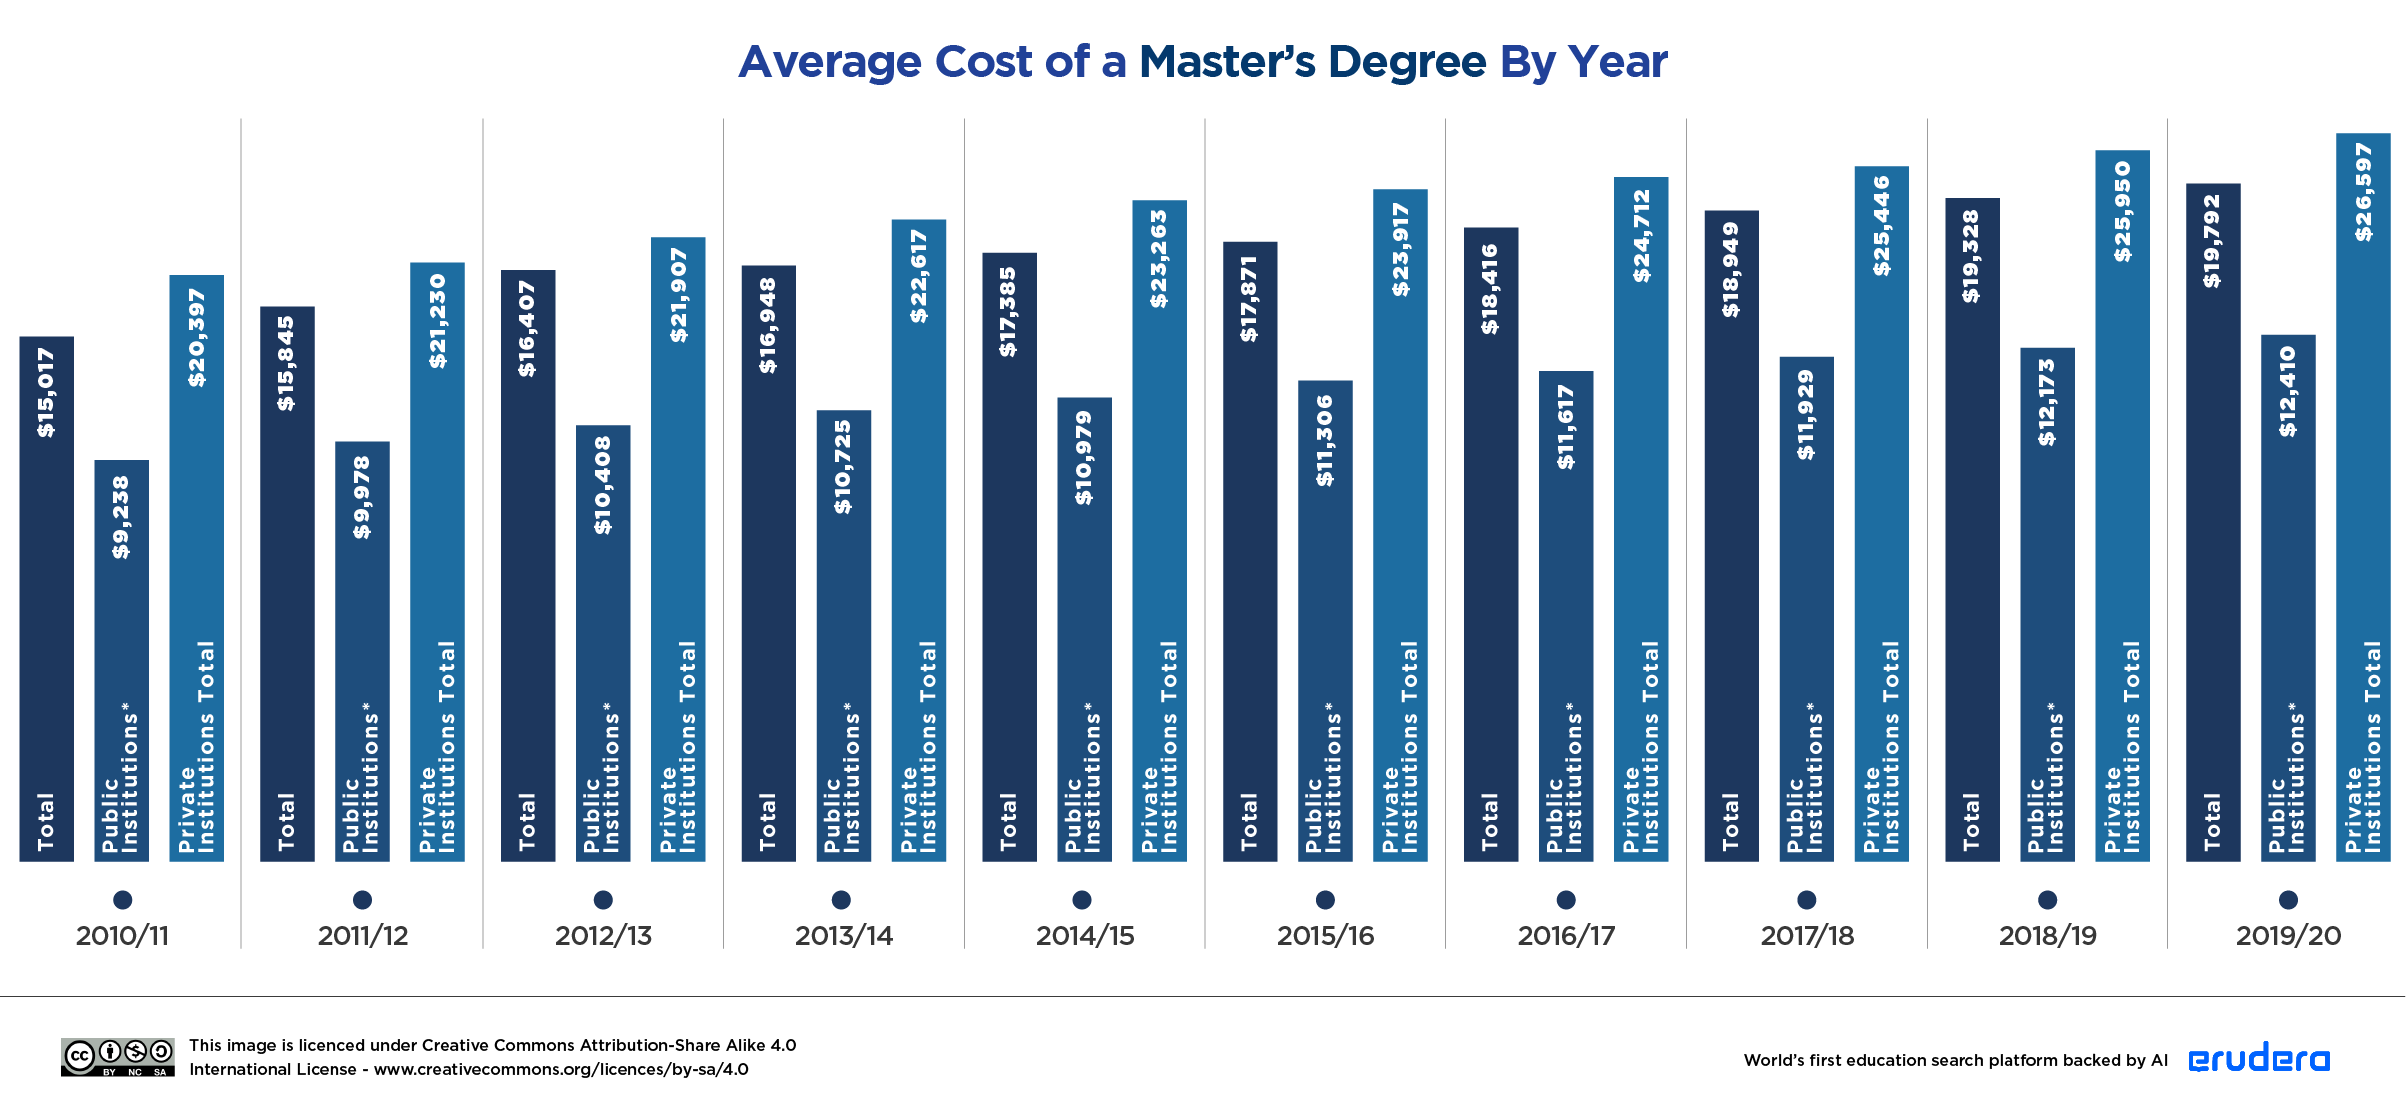
Average Cost of a Master’s Degree By Year
There have been significant changes in the cost of Master’s degrees throughout the years.
- In the academic year of 1989-1990, the total average cost of a master’s degree was $4,135 (or $9,223 after adjusting for inflation).
- In 2019-2020, the total average cost of a master’s degree averaged the amount of $19,792 (or $21,412 after adjusting for inflation).
- From the academic year of 1989-1990 to 2019-2020, the cost of a master’s degree increased by 378% (or by 132% after adjusting for inflation).
- The average cost of a master’s degree in public institutions during 1989-1990 was $1,999 which in 2019-2020 increased to $12,410 — showing an increase of 520% (or 201% after adjusting for inflation).
- During the academic year 1989-1990, the total average cost of a master’s degree in private institutions was $7,881 (or $17,579 after adjusting for inflation).
- In the 2019-2020 academic year, the total average cost of a master’s degree in private institutions was $26,597 (or $28,775 after adjusting for inflation).
- From 1989 to 2020 the total average cost of a master’s degree in private institutions increased by 229% (or by 62% after adjusting for inflation).
| Year | Total | Public Institutions* | Private Institutions Total | Nonprofit | For-profit |
|---|---|---|---|---|---|
| 1989-1990 | $4,135 ($9,223) | $1,999 ($4,459) | $7,881 ($17,579) | — | — |
| 1990-1991 | $4,488 ($9,498) | $2,206 ($4,668) | $8,507 ($18,003) | — | — |
| 1991-1992 | $5,116 ($10,389) | $2,524 ($5,126) | $9,592 ($19,479) | — | — |
| 1992-1993 | $5,475 ($10,793) | $2,791 ($5,502) | $10,008 ($19,730) | — | — |
| 1993-1994 | $5,973 ($11,433) | $3,050 ($5,838) | $10,790 ($20,653) | — | — |
| 1994-1995 | $6,247 ($11,659) | $3,250 ($6,066) | $11,338 ($21,160) | — | — |
| 1995-1996 | $6,741 ($12,234) | $3,449 ($6,260) | $12,083 ($21,929) | — | — |
| 1996-1997 | $7,111 ($12,536) | $3,607 ($6,359) | $12,537 ($22,101) | — | — |
| 1997-1998 | $7,246 ($12,487) | $3,744 ($6,452) | $12,774 ($22,013) | — | — |
| 1998-1999 | $7,685 ($13,040) | $3,897 ($6,613) | $13,299 ($22,567) | — | — |
| 1999-2000 | $8,069 ($13,396) | $4,042 ($6,711) | $13,821 ($22,946) | $14,123 ($23,447) | $9,611 ($15,956) |
| 2000-2001 | $8,429 ($13,539) | $4,243 ($6,815) | $14,420 ($23,162) | $14,457 ($23,221) | $13,229 ($21,249) |
| 2001-2002 | $8,857 ($13,833) | $4,496 ($7,022) | $15,165 ($23,684) | $15,232 ($23,789) | $13,414 ($20,950) |
| 2002-2003 | $9,226 ($14,185) | $4,842 ($7,444) | $14,983 ($23,036) | $15,676 ($24,101) | $9,644 ($14,827) |
| 2003-2004 | $10,312 ($15,501) | $5,544 ($8,334) | $16,209 ($24,365) | $16,807 ($25,264) | $12,542 ($18,853) |
| 2004-2005 | $11,004 ($16,112) | $6,080 ($8,902) | $16,751 ($24,527) | $17,551 ($25,698) | $13,133 ($19,229) |
| 2005-2006 | $11,621 ($16,458) | $6,493 ($9,196) | $17,244 ($24,421) | $18,171 ($25,734) | $13,432 ($19,023) |
| 2006-2007 | $12,312 ($16,892) | $6,894 ($9,458) | $18,108 ($24,844) | $19,033 ($26,113) | $14,421 ($19,785) |
| 2007-2008 | $13,002 ($17,348) | $7,415 ($9,893) | $18,878 ($25,188) | $19,896 ($26,546) | $14,713 ($19,631) |
| 2008-2009 | $13,647 ($17,532) | $7,999 ($10,276) | $19,230 ($24,704) | $20,485 ($26,316) | $14,418 ($18,522) |
| 2009-2010 | $14,542 ($18,748) | $8,763 ($11,298) | $20,078 ($25,885) | $21,317 ($27,483) | $14,512 ($18,709) |
| 2010-2011 | $15,017 ($19,048) | $9,238 ($11,718) | $20,397 ($25,872) | $21,993 ($27,897) | $13,811 ($17,518) |
| 2011-2012 | $15,845 ($19,483) | $9,978 ($12,269) | $21,230 ($26,105) | $22,899 ($28,157) | $14,285 ($17,565) |
| 2012-2013 | $16,407 ($19,765) | $10,408 ($12,538) | $21,907 ($26,391) | $23,642 ($28,481) | $14,418 ($17,369) |
| 2013-2014 | $16,948 ($20,122) | $10,725 ($12,734) | $22,617 ($26,853) | $24,482 ($29,067) | $14,209 ($16,870) |
| 2014-2015 | $17,385 ($20,312) | $10,979 ($12,827) | $23,263 ($27,179) | $25,168 ($29,405) | $14,264 ($16,665) |
| 2015-2016 | $17,871 ($20,855) | $11,306 ($13,194) | $23,917 ($27,910) | $25,826 ($30,138) | $14,432 ($16,842) |
| 2016-2017 | $18,416 ($21,223) | $11,617 ($13,388) | $24,712 ($28,479) | $26,551 ($30,598) | $14,784 ($17,037) |
| 2017-2018 | $18,949 ($21,382) | $11,929 ($13,460) | $25,446 ($28,713) | $27,356 ($30,868) | $14,304 ($16,140) |
| 2018-2019 | $19,328 ($21,289) | $12,173 ($13,408) | $25,950 ($28,583) | $27,802 ($30,623) | $14,209 ($15,651) |
| 2019-2020 | $19,792 ($21,412) | $12,410 ($13,426) | $26,597 ($28,775) | $28,430 ($30,758) | $14,289 ($15,459) |
In 2019-2020, the total average cost of a master’s degree for in-state students averaged $21,412.
Average Cost of a Master’s Degree By State
- The states with the most expensive graduate tuition fees include Connecticut, Delaware, Illinois, Massachusetts, Michigan, New Hampshire, New Jersey, Pennsylvania, Rhode Island, South Carolina, Virginia, and Vermont.
- The states with the lowest graduate tuition fees include Alaska, Arkansas, Florida, Georgia, Idaho, Iowa, Mississippi, North Carolina, Utah, West Virginia, and Wyoming.
- In California, tuition fees for graduate students at Stanford University average $54,315. At the California Institute of Technology, tuition fees for graduate students average $54,570.
- In Utah, the cost of tuition for graduate students averages the amount of $7,510 at Brigham Young University. At the University of Utah, in-state tuition averages $6,666, whereas out-of-state tuition averages the amount of $23,537.
- In Iowa, in-state tuition fees at the University of Iowa average the amount of $10,079, while out-of-state tuition averages the amount of $26,026. At Drake University, the average graduate student tuition averages the amount of $11,682.
- In Vermont, at the University of Vermont, the average in-state tuition for graduate students averages $12,294, whereas out-of-state tuition averages the amount of $30,960. At Bennington College, the average graduate student tuition is $24,132.
- In Virginia, at the University of Virginia, the average in-state tuition for graduate students is $17,076, while out-of-state tuition is $28,604. At the College of William and Mary, in-state tuition averages $10,516, while out-of-state tuition averages $28,305.
- In Nebraska, at Creighton University, the average graduate student tuition is $16,686. At the University of Nebraska-Lincoln, in-state tuition averages the amount of $6,138, while out-of-state tuition averages the amount of $17,928.
- In New Hampshire, at Dartmouth College, the average graduate student tuition is $57,796. At the University of New Hampshire, in-state tuition fees for graduate students average $14,170, while out-of-state tuition averages $27,810.
- In Washington, at the University of Washington, in-state tuition averages $16,278, while out-of-state tuition averages $29,178. At Gonzaga University, the average graduate student tuition averages $17,296.
- In Massachusetts, at Harvard University (the oldest college in the United States), the average graduate student tuition is $49,448. At the Massachusetts Institute of Technology, graduate tuition averages the amount of $53,450.
Stanford University in California is one of the most expensive universities for graduate students — charging an average of $54,315 per year for a master’s degree.
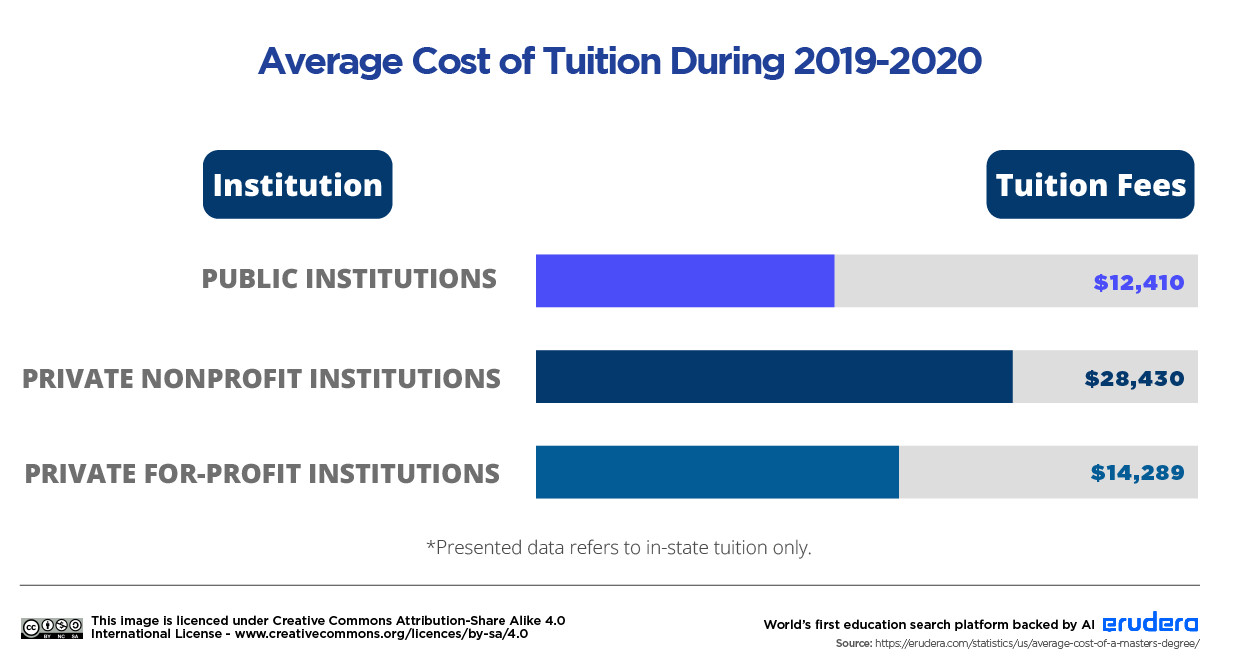
Average Cost of a Master’s Degree By Institution
The cost of a master’s degree differs between public and private institutions. Usually, private institutions charge higher tuition fees.
- The average cost of a master’s degree in public institutions is $12,410 per year.
- The average cost of a master’s degree in private nonprofit institutions is $28,430.
- In comparison to private nonprofit institutions, the average cost of a master’s degree in public institutions is lower — showing a 78% difference between the two (specifically, $12,410 and $28,430).
- The average cost of a master’s degree in private for-profit institutions is $14,289.
- In comparison to public institutions, the average cost of a master’s degree in private for-profit institutions is slightly higher — showing a 14% difference between the two (specifically $12,410 and $14,289).
- Between private institutions, the cost of a master’s degree in nonprofit institutions is higher than in for-profit institutions — showing a 66% difference between the two (specifically $28,430 and $14,289).
- The total average cost of a master’s degree for out-of-state students ranges from $30,000 to $150,000.
- In Alabama, tuition fees for graduate students at Auburn University range from $10,080 for in-state students to $30,240 for out-of-state students.
- In the University of Alabama, tuition fees for graduate students range from $10,780 for in-state students to $30,250 for out-of-state students.
Average Cost of Tuition During 2019-2020
| Institution | Tuition Fees |
|---|---|
| Public Institutions | $12,410 ($13,426) |
| Private Nonprofit Institutions | $28,430 ($30,758) |
| Private For-profit Institutions | $14,289 ($15,459) |
Private nonprofit institutions charge graduate in-state students with the highest tuition fees ($28,430 or $30,758 after adjusting for inflation).
Average Cost of a Master’s Degree By Type
The average cost of a master’s degree varies by degree program.
- Although average estimates of master’s degrees in the United States are around $60,000 per year (usually in private non-profit institutions), it is highly possible to pursue graduate degrees at much lower rates in public or private for-profit institutions.
- The cost for an MBA at the University of Stanford is $74,706 per year.
- The average cost for a science degree at Princeton University is $56,010.
- In 2021-2022, at the University of California - Berkeley, the cost of an engineering degree ranges from $13,028 to $39,051 depending on the student’s country of origin.
- During the 2003-2004 academic year, the average cost of attendance in the engineering, computer science, and mathematics fields was $21,000.
- A master’s degree in Education can cost anywhere from $6,500 to $32,695 at New York University (Steinhardt).
- $42,275 is the cost of tuition for students pursuing a master’s degree at Yale School of Art during 2021-2022.
- In 2015-2016, the average total price of attendance for students pursuing a master’s degree was $25,000.
Master of Business Administration
- A Master’s degree in Business Administration costs an average of $66,300.
- During 2018-2019, there were a total of 197,089 Master’s degrees conferred in the field of business.
- The University of Stanford charges students pursuing an MBA around $74,706 per year.
- At the University of Chicago Booth School of Business, the cost of tuition for an MBA degree is $149,838 (for the two-year program).
- The Wharton School at the University of Pennsylvania charges students $136,420 for an MBA degree.
- At Harvard Business School, the cost of an MBA was originally set at $73,440. However, due to the pandemic, it was adjusted to $68,440 per year.
- During the 2003-2004 academic year, the average total price of attendance for an MBA degree was $23,000. In 2015-2016, it increased to $27,600 or by 20%.
The University of Stanford charges MBA students some of the highest tuition fees ($74,706 per year).
Master of Science
- A Master’s degree in Science costs an average of $62,300.
- At Princeton University, the regular cost of tuition for students pursuing a science degree is $56,010.
- At the University of California - Berkeley, during the academic year of 2021-2022, the cost of a master’s degree in the field of engineering ranges from $13,028 to $35,822 for in-state students. For out-of-state students it ranges from $19,151 to $39,051.
- At Carnegie Mellon University, during the academic year of 2021-2022, the cost of a master’s degree in the fields of engineering, information networking, computer science, computational finance, and entertainment technology center ranges from $50,100 to $90,000.
- In 2003-2004, the average total price of attendance in social/behavioral sciences was $22,500. During the academic year of 2015-2016, it rose to $26,600 or by 18.22%.
- The average total price of attendance in life and physical sciences during the academic year of 2003-2004 was $21,800. In the 2015-2016 academic year, it increased to $25,800 or by 18.35%.
- The average cost of attendance in health sciences was $24,200 during 2003-2004 — which during the academic year of 2015-2016 increased by 4.55% ($25,300).
- The average cost of attendance in the engineering, computer science, and mathematics fields was $21,000 during the 2003-2004 academic year. In 2015-2016, there was an increase of 24% in the cost of attendance in these fields.
The average cost of attendance in the engineering, computer science, and mathematics fields was $21,000 during the 2003-2004 academic year. In 2015-2016, there was an increase of 24% in the cost of attendance in these fields.
Master of Education
- A Master’s degree in Education costs an average of $55,200 in total.
- At Harvard Graduate School of Education, a master’s degree in Education costs an average of $51,904 per academic year.
- For the academic year of 2021-2022, at the University of Wisconsin-Madison, the cost of a master’s degree in education ranges from $12,220 to $25,548.
- At New York University (Steinhardt), during the academic year of 2021-2022, tuition fees for a master’s degree in education range from $6,500 to $32,695.
- At Teachers College Columbia University, the cost of tuition for the academic year of 2021-2022 ranges from $9,683 to $17,039.
- The average cost of attendance in education during the academic year of 2003-2004 was $16,000. In 2015-2016, it increased to $19,300 or by 20%.
Tuition fees for a master’s degree in Education start as low as $6,500 per year.
Master of Arts
- A Master’s degree in Arts costs an average of $72,800 in total.
- At the University of California, Los Angeles (UCLA), graduate tuition fees for residents reach the amount of $17,836, and $32,938 for out-of-state residents.
- At Yale School of Art, tuition fees for graduate students reach the amount of $42,275.
- At the School of the Art Institute of Chicago (SAIC), the cost of tuition ranges from $21,576 to $53,940.
- In the academic year of 2003-2004, the average cost of attendance in Arts was $21,600. In 2015-2016, it increased by 24% ($26,900).
A Master’s degree in Arts costs an average of $72,800 in total.
Other Master’s Degrees
The total average cost of master’s degrees in this category is $75,100 in totalial Work (M.S.W), Master of Public Administration (M.P.A), and Master of Fine Arts (M.F.A).
- The total average cost of master’s degrees in this category is $75,100 in total.
- At UCLA the cost of an Art M.F.A degree is $26,314 for in-state students and $35,379 for out-of-state students.
- At the same institution, the cost of a master’s degree in Film and Television (M.F.A) is 31,249 for in-state students and $43,494 for out-of-state students.
- The average cost of attendance for students in this category was $22,100 during 2003-2004, which during 2015-2016 increased by 18% ($26,100).
The average cost of attendance for students in the “Other Master’s degrees” category during 2015-2016 was $26,100.
Average Cost of Online Master’s Degree
Colleges and universities have started to invest heavily in online education. During 2020, 42% (approximately 1.3 million) of all graduate students were enrolled in at least one distance education course.
- Private for-profit institutions have the highest percentage of enrolled students in distance education — a total of 87%.
- 30% of students enrolled in distance education attend a private nonprofit institution and 27% are enrolled in distance education at a public university.
- At the University of Stanford, online courses have 3-5 units, and the cost per unit is $1,352.
- At New York University, the Online Master of Health Administration degree program has 45 credit hours — where the cost per credit is $2,011.
- At Ohio State University, the cost of an online Master of Dental Hygiene degree is $24,256 for Ohio residents and $25,056 for non-Ohio residents.
- At the same institution, pursuing a Master of Public Health degree will cost Ohio residents an average of $4,435 per semester, and an average of $4,635 per semester to non-Ohio residents.
- In 2021, at the University of Maryland Global Campus, master’s degrees have between 30 and 42 credits — where in-state students pay from $504 to $694 per credit, and out-of-state students pay from $659 to $694 per credit.
- At Georgia Tech Professional Education, the cost of an online master’s degree in Cybersecurity is $310 per credit hour, and the course has 32 credit hours.
- At the same institution, graduate students can also earn an online graduate certificate in Data Science for the Chemical Industry — where the cost per credit hour is $1,100 and the program has 4 courses with 12 credit hours.
*Percentages in this section were calculated based on the number of all students that took distance education courses, regardless of their location (including those residing outside the US or in an unknown location).
In 2020, 42% (approximately 1.3 million) of all graduate students were enrolled in at least one distance education course.
Average Graduate Student Loan Debt
The second-highest source of household debt is student loan debt. During the academic year of 2020-2021, the average aid per full-time equivalent (FTE) graduate student was $26,920.
- In 2021, the total federal loan aid reached the amount of $38,962 million.
- During the same year, the average federal loan per FTE reached the amount of $17,543.
- The total federal and nonfederal loan aid during 2021 reached the amount of $40,289 million.
- The average federal and nonfederal loans per FTE reached the amount of $18,140 during the same time period.
- The total federal loan aid during 2014-2015 was $38,477 million.
- During 2015-2016, a total of 60% of master’s students had student loans.
- From the academic year of 2014-2015 to 2019-2020, there was only a slight increase of 1.33% in the total federal loan aid ($38,990 million).
- The average federal loans per FTE were $18,454 during 2014-2015 and then decreased by 3.46% in 2019-2020 ($17,816).
- During the academic year of 2015-2016, the total federal and nonfederal loan aid was $39,975 million. In 2019-2020, it increased by only 1.49% ($40,570 million).
- In 2014-2015, the average federal and nonfederal loans per FTE were $19,173. In 2019-2020, they decreased by 3.32% ($18,537).
| Year |
Total Federal Loan Aid (in Millions) |
Average Federal Loans per FTE |
Total Federal and Nonfederal Loan Aid (in Millions) |
Average Federal and Nonfederal Loans per FTE |
| 2014-2015 | $38,477 | $18,454 | $39,975 | $19,173 |
| 2015-2016 | $38,996 | $18,534 | $40,557 | $19,276 |
| 2016-2017 | $39,760 | $18,745 | $41,293 | $19,468 |
| 2017-2018 | $39,655 | $18,535 | $41,016 | $19,171 |
| 2018-2019 | $39,135 | $18,103 | $40,597 | $18,779 |
| 2019-2020 | $38,990 | $17,816 | $40,570 | $18,537 |
| 2020-2021* | $38,962 | $17,543 | $40,289 | $18,140 |
During the academic year of 2020-2021, the average aid per full-time equivalent (FTE) graduate student was $26,920.
Average Graduate Student Loan Debt Demographics
There are some differences in the average graduate loan debt related to the age, gender, race, and ethnicity of the student.
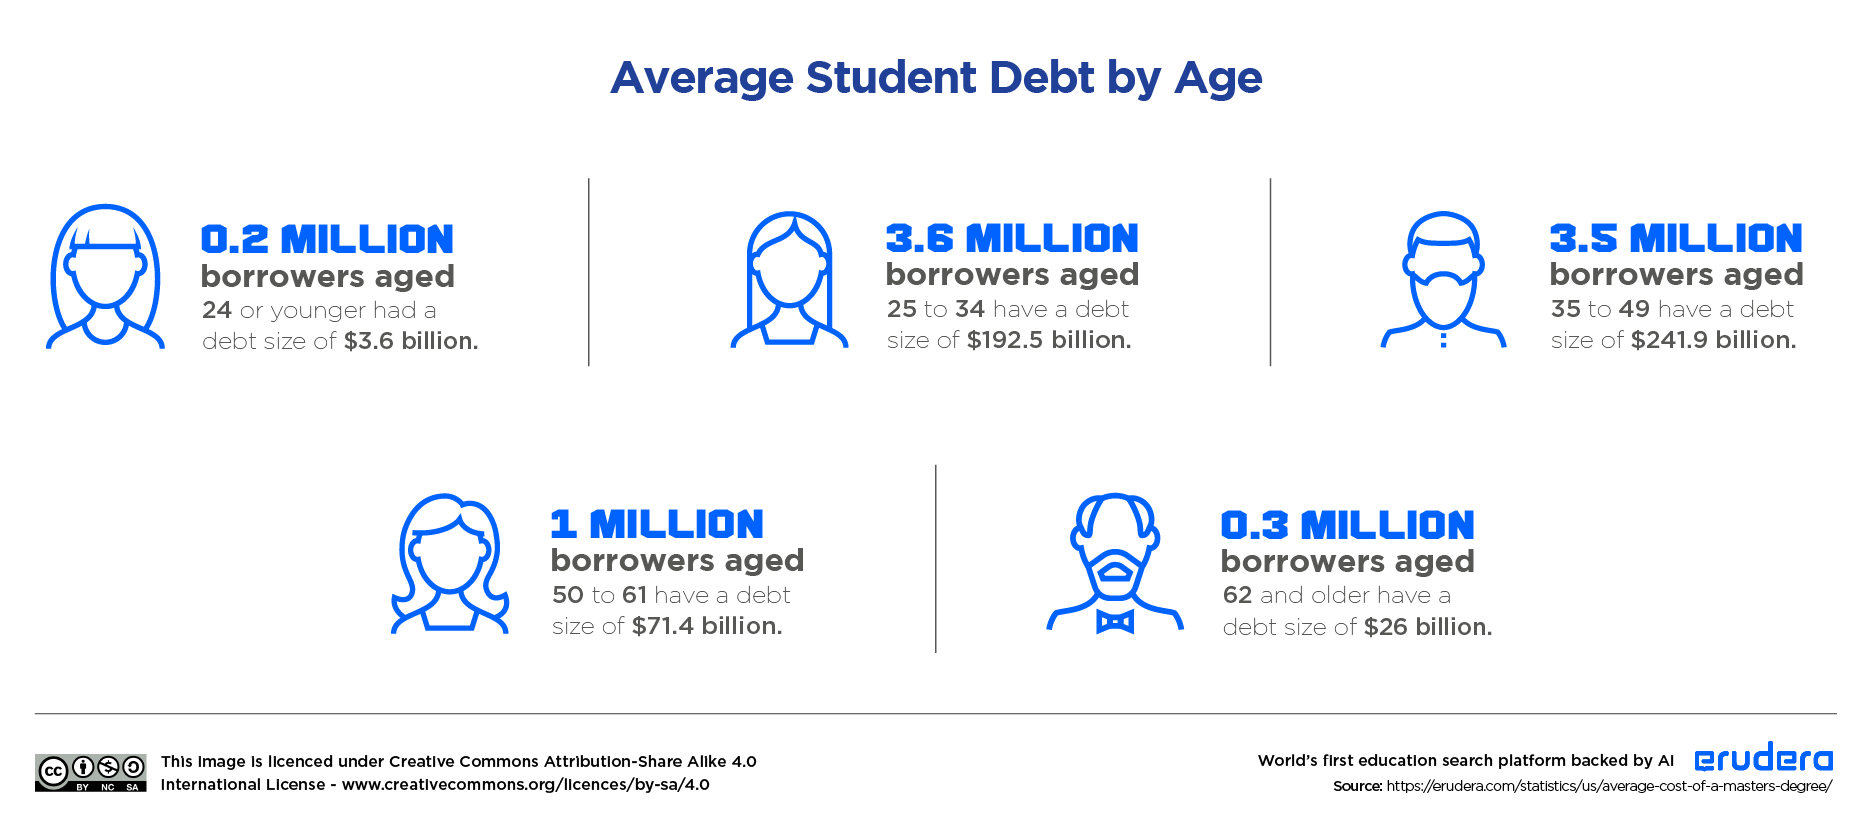
Average Student Debt by Age
- Reports state that the age at which a student enters college plays an important role in their ability to pay off debt.
- 12 years after leaving school, students who start college at age 20 or older have paid off a minimum of 5% of their debt on average.
- Students that have entered college at age 18 or 19 have paid off more than one-fourth of their debt 12 years after leaving college.
- During the third quarter of 2021, 0.2 million borrowers aged 24 or younger had a debt size of $3.6 billion.
- 3.6 million borrowers aged 25 to 34 have a debt size of $192.5 billion.
- 3.5 million borrowers aged 35 to 49 have a debt size of $241.9 billion.
- 1.0 million borrowers aged 50 to 61 have a debt size of $71.4 billion.
- 0.3 million borrowers aged 62 and older have a debt size of $26.0 billion.
Average Student Debt by Race
- The Federal Reserve System states that 2 in 10 adults are behind on their loan payments.
According to the Federal Reserve System, Black and Hispanic borrowers are more likely to be behind on their loan repayment than White borrowers. - From all White borrowers, 6% are behind on their loan repayments. 40% are repaying their debt on time and 54% have already paid off their debt.
- From all Black borrowers, 21% are behind on their loan repayments. 47% are repaying their debt on time and 31% have already paid off their debt.
- From all Hispanic borrowers, 16% are behind on their loan repayments. 58% are repaying their debt on time and 33% have already paid off their debt.
- An American Indian or Alaska Native woman owes $61,830.
- On average, an Asian woman owes $70,797.
- A Black or African American woman owes an average of $75,085.
- A Hispanic or Latina woman owes an average of $56,104.
- A White woman owes an average of $56,098.
Average Student Debt by Gender
- On average, women face larger debt burdens than men.
- In order to earn an equal wage to male graduates that hold an associate degree, women typically require more education — in this case earning at least a master’s degree.
- Due to the lack of equal pay, and general financial difficulties, women are forced to delay purchasing a house, starting their own business, or saving for retirement.
- According to AAUW (American Association of University Women), women hold approximately $929 billion of all U.S. student loan debt.
- Black women owe the largest amount of debt (an average of $41,466), followed by White, Hispanic/Latinx, and Asian borrowers.
- Reports state that white men have paid off 44% of their student loans 12 years after starting college, while black women owe 13% more.
- In Virginia, during 2019-2020, the average debt of graduate male students was $41,056. The average debt of graduate female students was $41,132.
- In 2015-2016, a total of 63.9% of male students took out federal loans, from which 8.7% were graduate students — borrowing an average of $26,100.
Average Student Debt By Institution Type
- 8% of borrowers that attended public institutions are behind on their student loan payments. 44% are repaying their debt on time, and 48% have already paid off their debt.
- Of the students that attended private nonprofit institutions, 5% are behind on their loan payments, 42% are repaying their debt on time, and 53% have already paid off their debt.
- 22% of the students that attended private for-profit institutions are behind on their loan payments, 40% are repaying their debt on time, and 38% have already paid off their debt.
- During the academic year of 2015-2016, the average student debt across all types of institutions was $64,400.
- The average debt for students that attended public institutions during 2015-2016 was $53,500.
- In 2015-2016, students that attended private nonprofit institutions had an average debt of $70,600.
- During the same time period, graduate students that attended private for-profit institutions had an average debt of $88,700.
How Do Graduate Students Pay For Their Degree?
Students use different ways to pay for their degree including savings, borrowings, grants and scholarships, their own earnings, or external contributions.
- In 2021, the average amount American families spent on college was $26,373. In 2020, American families reported paying $30,017 for college — showing a 12% decrease.
- In 2021, parent income and savings covered 45% of college costs.
- Scholarships and grants covered 25% of college costs.
- 11% of college costs were covered by student borrowing.
- 9% of college costs were covered by parent borrowing.
- 8% of college costs were covered by student income and savings.
- 2% of college costs were covered by relatives and friends.
- During the academic year of 2016-2017, the average annual amount graduate students spent on grad school was $24,812.
- Between 2017 ($24,812) and 2021 ($26,373), there was a 6.29% increase in the average annual amount spent on grad school.
- A typical student pays for graduate school mostly by means of student borrowings, which contribute to approximately 53% of college expenses (or around $13,151).
- For the same student, the remaining majority of college expenses (around 24%) are paid through students’ own earnings, amounting to $6,007 on average.
- Additionally, grants and scholarships pay for about 15% of a typical student’s college expenses, contributing $3,715 on average.
- External contributions pay an average of $1,797, or 7% of the total cost of graduate school.
- A typical student also pays for college with money borrowed on their behalf, which amounts to $142 or around 1% of the total college expenses.
| Degree Type | Student Borrowing | Someone Else Borrowing | Student Earnings | External Contributions | Grants & Scholarships |
|---|---|---|---|---|---|
| Education Majors | 54% | 0% | 29% | 9% | 9% |
| Engineering Majors | 32% | 0% | 30% | 17% | 21% |
| Health Science Majors | 57% | 1% | 15% | 7% | 19% |
| Humanities and Arts Majors | 44% | 2% | 27% | 8% | 19% |
| Law Majors | 60% | 0% | 18% | 2% | 20% |
| Math and Science Majors | 46% | 0% | 23% | 10% | 21% |
| MBA Majors | 54% | 0% | 37% | 3% | 6% |
Graduate students mostly pay for their degree by borrowing or using their own earnings.
Sources:
- https://nces.ed.gov/programs/digest/d18/tables/dt18_330.50.asp
- https://nces.ed.gov/programs/digest/d19/tables/dt19_330.50.asp
- https://nces.ed.gov/programs/coe/indicator/tub
- https://nces.ed.gov/programs/digest/d20/tables/dt20_323.10.asp
- https://nces.ed.gov/programs/coe/indicator/ctb
- https://files.eric.ed.gov/fulltext/ED594431.pdf
- https://nces.ed.gov/blogs/nces/post/trends-in-graduate-student-loan-debt
- https://nces.ed.gov/ipeds/Search/ViewTable?tableId=28460&returnUrl=%2Fipeds%2FSearch
- https://nces.ed.gov/fastfacts/display.asp?id=900
- https://www.federalreserve.gov/publications/2019-economic-well-being-of-us-households-in-2018-student-loans-and-other-education-debt.htm
- https://www.aauw.org/app/uploads/2021/05/Deeper_In_Debt_2021.pdf
- https://research.collegeboard.org/trends/student-aid/highlights
- https://www.usnews.com/education/online-education/texas-a-m-university-OEDU0705/education
- https://nces.ed.gov/pubs2019/2019485.pdf
- https://nces.ed.gov/programs/coe/indicator/chb
- https://nces.ed.gov/programs/digest/d12/tables/dt12_385.asp
- https://nces.ed.gov/programs/digest/d19/tables/dt19_318.10.asp
- https://www.marketwatch.com/story/12-years-after-starting-college-white-men-have-paid-off-44-of-their-student-loans-and-black-women-owe-13-more-2019-06-06